Understanding COVID-19 Transmission With Non-Markovian Models

With COVID-19, the world has experienced the most significant pandemic of contemporary history. In an effort to reduce virus transmission, different mitigation strategies have been proposed and implemented. In this situation, models of disease transmission have emerged as a key tool to predict current and future characteristics of COVID-19 spreading, with or without the implementation of mitigation strategies, and to guide policymaking decisions. Models however are accurate predictors if they are built upon reliable data and evidence-supported assumptions. Large swings in model predictions can be imputed to assumptions not supported by data or evidence, with consequences on the model reliability. One typical assumption is the exponential distribution of the transition times of individuals between different states of disease (i.e., compartments that mark individuals as susceptible, exposed, infected, and recovered). However, recent observations of COVID-19 data, highlight non-exponential distributions for some critical transition times, such as the infectious period. This directly impacts the accuracy of the models. With this in mind, the goals of this project are to: 1) develop network-based compartmental meta-population models that accept arbitrary distributions for the transition times of the individual between different compartments; 2) develop rigorous methodologies to estimate unknown parameters of the model using stochastic optimization methods; 3) determine contact networks tailored for regions receiving lower attention, such as rural areas. Successful completion of this project will provide benefits to the USA public health, in particular to the analysis and monitoring of COVID-19. More accurate model-based testing of mitigation strategies will help public health officials to select strategies and to gather trust and support around mitigation policies. This way, health policymakers, modelers, and the general public will share common goals toward eventually stopping COVID-19.
Investigators
Faculty and Scholars
Caterina Scoglio (Google Profile) (PI)
Students
Products
Journals
- Qihui Yang, Chunlin Yi, Aram Vajdi, Lee W. Cohnstaedt, Hongyu Wu, Xiaolong Guo, Caterina M. Scoglio, "Short-term forecasts and long-term mitigation evaluations for the COVID-19 epidemic in Hubei Province, China", Infectious Disease Modelling, Volume 5, 2020, Pages 563-574.
- Sifat Afroj Moon, Caterina Scoglio "Contact Tracing Evaluation for COVID-19 Transmission during the Reopening Phase in a Rural College Town" Scientific Reports 11: 4891, March 1, 2021.
- Qihui Yang, Don M. Gruenbacher, Caterina M. Scoglio. "Estimating data-driven COVID-19 mitigation strategies for safe university reopening." Journal of the Royal Society Interface, 2021.
- Aram Vajdi, Lee W. Cohnstaedt, Leela E. Noronhaz, Dana N. Mitzelz, William C. Wilsonz, Caterina M. Scoglio. "A Non-Markovian Model to Assess Contact Tracing for the Containment of COVID-19." arXiv, 2021.
- Joan Saldana, Caterina M. Scoglio. "Influence of heterogeneous age-group contact patterns on critical vaccination rates for herd immunity to SARS-CoV-2." Scientific reports, 2021.
Posters
- Aram Vajdi, Sifat Moon, Qihui Yung, Joan Saldana, Caterina Scoglio, "Mitigation of COVID-19 transmission in college towns of Kansas", NSF PREPARE Workshop, 15-16 December 2020.
Presentations
- "Estimating data-driven COVID-19 mitigation strategies for safe university reopening." The 6th Annual Meeting of SIAM Central States Section, October 2 - October 3, 2021, University of Kansas, Lawrence, Kansas.
Data
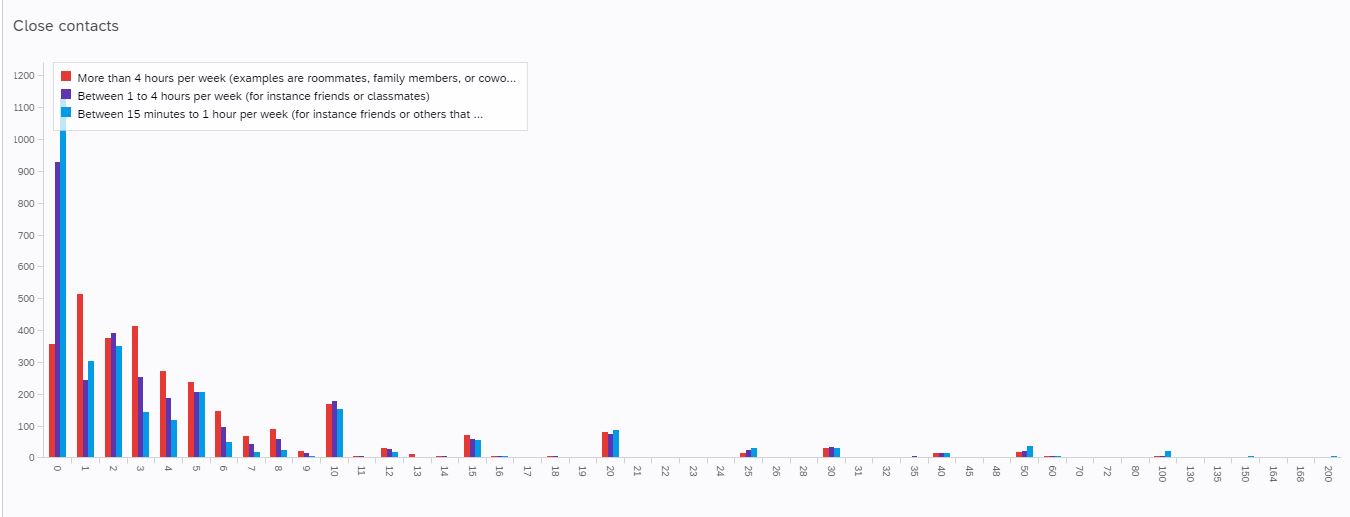
In November 2020, we developed a survey administered to all students, faculty, and staff at Kansas State University. We sent emails to 6196 faculty and staff, and 20755 students. We received 3242 responses with a success rate of around 12%. The survey consisted in 11 questions, as follow: consent (Q1), age segment (Q2), role at K-State (Q3), housing status (Q4), number of close contacts in a week by duration ranges (Q5), number and duration of contacts in different locations (Q6-Q10), max number of contacts during Thanksgiving week. In the following, we report the graph showing the close-contact number distribution for more than 4 hours per week (red), between 1 and 4 hours (purple), and between 15 minutes and 1 hour (blue). It is possible to observe high numbers of contacts for a few individuals.
Supported by National Science Foundation under Award IIS-2027336. Any opinions, findings, and conclusions or recommendations expressed in this website are those of the author(s) and do not necessarily reflect the views of the National Science Foundation.